
Dental Marketing ROI Benchmarks: What to Expect in 2026
Industry data on dental marketing costs, returns, and performance benchmarks. Understand what results you should expect from SEO, Google Ads, social media, and other marketing channels.
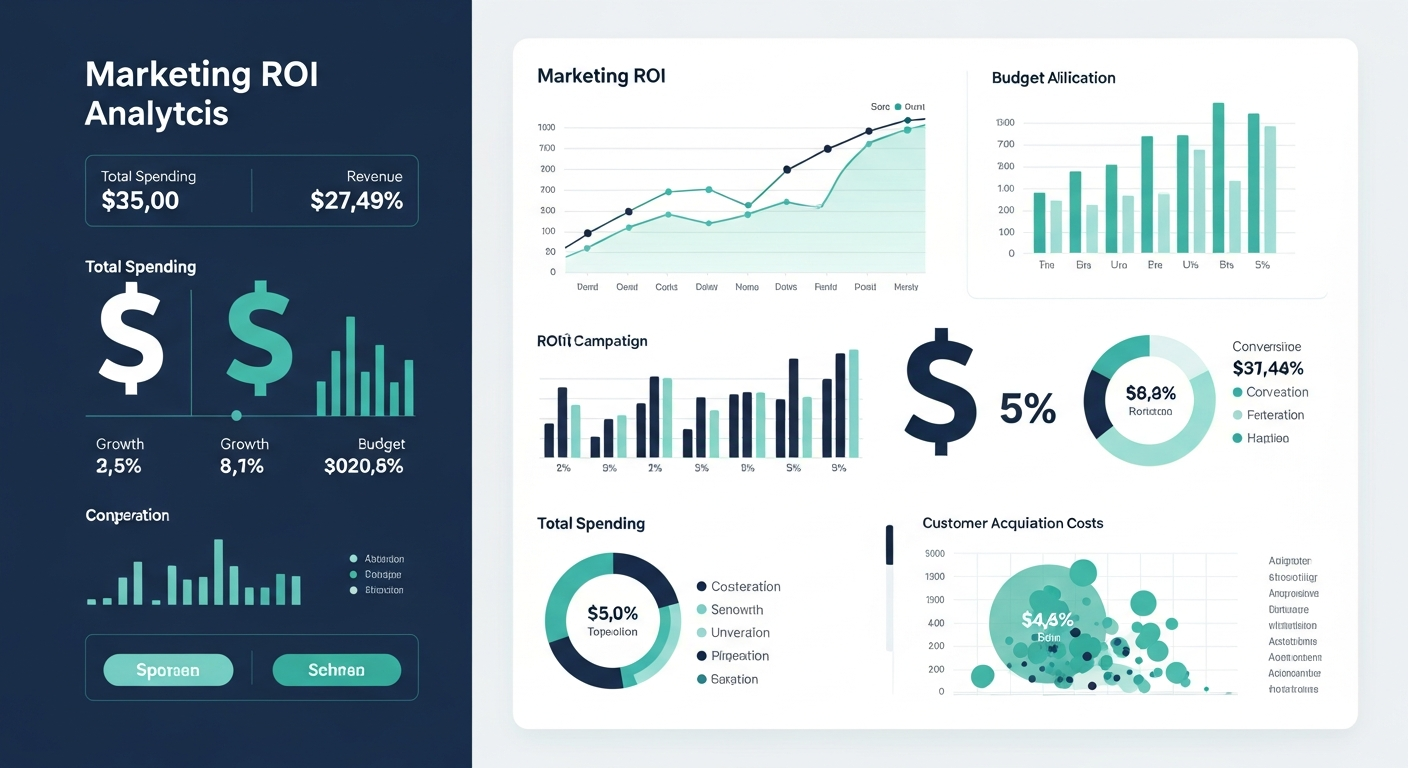
Understanding marketing ROI benchmarks helps you set realistic expectations, evaluate vendor performance, and make informed investment decisions. This guide provides current data on dental marketing costs, typical returns, and performance standards across channels.
Why Benchmarks Matter
Benchmarks provide context for evaluating your marketing:
Setting expectations: Know what results are realistic before investing.
Evaluating performance: Compare your results against industry standards.
Identifying problems: Underperformance against benchmarks signals issues to address.
Budget planning: Understand typical costs for planning purposes.
Vendor accountability: Hold agencies accountable to industry standards.
A word of caution: benchmarks are averages. Your specific results depend on market competitiveness, practice reputation, service mix, and many other factors. Use benchmarks as reference points, not guarantees.
Website Performance Benchmarks
Your website's performance directly impacts marketing ROI. Poor websites waste advertising spend.
Conversion Rate Benchmarks
| Metric | Below Average | Average | Above Average | Excellent | |--------|--------------|---------|---------------|-----------| | Overall conversion rate | <2% | 2-3% | 3-5% | >5% | | Mobile conversion rate | <1.5% | 1.5-2.5% | 2.5-4% | >4% | | Landing page conversion | <3% | 3-5% | 5-8% | >8% |
Conversion rate factors:
- Website design and usability
- Page load speed
- Call-to-action clarity
- Trust signals and social proof
- Mobile optimization
Page Speed Benchmarks
| Metric | Poor | Needs Improvement | Good | Excellent | |--------|------|-------------------|------|-----------| | Time to First Byte | >0.8s | 0.5-0.8s | 0.2-0.5s | <0.2s | | Largest Contentful Paint | >4s | 2.5-4s | 1.5-2.5s | <1.5s | | Total Page Load | >5s | 3-5s | 2-3s | <2s |
Every second of delay reduces conversions by approximately 7%. Speed optimization often provides the highest ROI of any website improvement.
Learn about our website optimization services.
Google Ads Benchmarks
Google Ads provide the most immediate and measurable marketing channel.
Cost Per Click (CPC) by Market Size
| Market Type | General Dentistry | Dental Implants | Cosmetic Dentistry | Emergency Dental | |-------------|-------------------|-----------------|--------------------|--------------------| | Small metros | $8-15 | $15-30 | $12-25 | $10-20 | | Medium metros | $15-30 | $30-60 | $25-45 | $20-35 | | Large metros | $30-60 | $60-100+ | $45-80 | $35-60 |
Cost Per Lead Benchmarks
| Service Type | Below Average | Average | Above Average | Excellent | |--------------|--------------|---------|---------------|-----------| | General dentistry | >$150 | $100-150 | $60-100 | <$60 | | Dental implants | >$350 | $200-350 | $120-200 | <$120 | | Cosmetic dentistry | >$250 | $150-250 | $80-150 | <$80 | | Emergency dental | >$100 | $60-100 | $35-60 | <$35 | | Invisalign/Ortho | >$200 | $120-200 | $70-120 | <$70 |
Click-Through Rate (CTR) Benchmarks
| Position | Below Average | Average | Above Average | Excellent | |----------|--------------|---------|---------------|-----------| | Search (top 3) | <3% | 3-5% | 5-8% | >8% | | Search (all) | <2% | 2-4% | 4-6% | >6% | | Display | <0.2% | 0.2-0.5% | 0.5-1% | >1% |
Quality Score Benchmarks
Google's Quality Score (1-10) impacts costs and performance:
| Score | Interpretation | Cost Impact | |-------|---------------|-------------| | 1-4 | Poor | +50-400% cost premium | | 5-6 | Average | Baseline costs | | 7-8 | Good | 10-25% cost discount | | 9-10 | Excellent | 25-50% cost discount |
Learn about our Google Ads management.
SEO Performance Benchmarks
SEO produces the best long-term ROI but requires patience and sustained investment.
Timeline Benchmarks
| Milestone | Typical Timeline | Range | |-----------|------------------|-------| | Initial ranking improvements | 3-4 months | 2-6 months | | Meaningful traffic increase | 5-7 months | 4-9 months | | Target keyword rankings | 6-9 months | 4-12 months | | Full SEO maturity | 12-18 months | 9-24 months |
Traffic Growth Benchmarks
| Period | Below Average | Average | Above Average | Excellent | |--------|--------------|---------|---------------|-----------| | Month 6 | <20% increase | 20-40% | 40-60% | >60% | | Month 12 | <50% increase | 50-100% | 100-150% | >150% | | Month 18 | <80% increase | 80-150% | 150-250% | >250% |
Cost Per Lead from SEO
Once established, SEO typically delivers the lowest cost per lead:
| Stage | Typical CPL | |-------|-------------| | Year 1 (building) | $50-150 (includes investment) | | Year 2+ (mature) | $15-40 | | Established authority | $10-25 |
These costs account for ongoing SEO investment divided by leads generated. The compounding nature of SEO means costs decrease over time as results increase.
Social Media Advertising Benchmarks
Facebook and Instagram ads work best for awareness and specific patient segments.
Facebook Ads Benchmarks
| Metric | Below Average | Average | Above Average | Excellent | |--------|--------------|---------|---------------|-----------| | CPM (cost per 1000 impressions) | >$25 | $15-25 | $10-15 | <$10 | | CPC | >$3 | $1.50-3 | $0.75-1.50 | <$0.75 | | CTR | <0.5% | 0.5-1% | 1-2% | >2% | | Cost per lead | >$80 | $40-80 | $20-40 | <$20 |
Note: Facebook leads typically require more nurturing than Google search leads, as they represent lower-intent patients. Factor this into ROI calculations.
Instagram Ads Benchmarks
| Metric | Below Average | Average | Above Average | Excellent | |--------|--------------|---------|---------------|-----------| | CPM | >$15 | $8-15 | $5-8 | <$5 | | CPC | >$2 | $1-2 | $0.50-1 | <$0.50 | | Engagement rate | <1% | 1-3% | 3-5% | >5% |
Learn about our social media marketing.
Overall ROI Benchmarks
New Patient Value
Understanding patient value is essential for ROI calculation:
| Practice Type | Average First-Year Value | Lifetime Value (5-year) | |---------------|-------------------------|------------------------| | General practice | $800-1,200 | $2,500-4,500 | | Cosmetic focus | $1,500-3,000 | $4,000-8,000 | | Implant focus | $3,000-6,000 | $6,000-15,000 | | Orthodontics | $4,000-6,500 | $4,500-7,000 |
Marketing ROI by Channel
| Channel | Typical ROI Range | Time to ROI | |---------|-------------------|-------------| | Google Ads | 3:1 to 8:1 | 1-3 months | | SEO (mature) | 5:1 to 15:1 | 12-18 months | | Facebook Ads | 2:1 to 5:1 | 1-3 months | | Direct mail | 1:1 to 3:1 | Immediate | | Email marketing | 10:1 to 30:1 | Ongoing |
Budget Allocation Benchmarks
Typical marketing budget allocation for growing practices:
| Channel | Startup Practice | Established Practice | Multi-Location | |---------|-----------------|---------------------|----------------| | Website | 20-30% | 5-10% | 5-10% | | SEO | 15-25% | 25-35% | 20-30% | | Google Ads | 30-40% | 30-40% | 30-40% | | Social Media | 10-15% | 10-15% | 10-15% | | Other | 5-10% | 10-15% | 10-15% |
Lead Quality Benchmarks
Not all leads are equal. Track these quality metrics:
Lead-to-Appointment Rate
| Source | Below Average | Average | Above Average | Excellent | |--------|--------------|---------|---------------|-----------| | Google Ads | <30% | 30-45% | 45-60% | >60% | | SEO | <35% | 35-50% | 50-65% | >65% | | Facebook | <20% | 20-35% | 35-50% | >50% | | Referrals | <50% | 50-65% | 65-80% | >80% |
Appointment-to-Treatment Rate
| Metric | Below Average | Average | Above Average | Excellent | |--------|--------------|---------|---------------|-----------| | Show rate | <70% | 70-80% | 80-90% | >90% | | Case acceptance | <40% | 40-55% | 55-70% | >70% | | Second appointment booking | <60% | 60-75% | 75-85% | >85% |
Industry-Specific Benchmarks
By Practice Type
| Practice Type | Typical Marketing Spend | Expected New Patients/Month | |---------------|------------------------|----------------------------| | Solo GP | $3,000-8,000 | 15-35 | | Group GP (2-3 providers) | $8,000-20,000 | 35-80 | | Specialty practice | $5,000-15,000 | 10-30 | | DSO/Multi-location | $10,000-50,000+ per location | 40-100+ per location |
By Market Competitiveness
| Market Type | Cost Per New Patient | Timeline to Results | |-------------|---------------------|---------------------| | Rural/Low competition | $150-300 | 2-4 months | | Suburban/Medium | $250-450 | 4-6 months | | Urban/High competition | $400-700+ | 6-12 months |
Using Benchmarks Effectively
For Goal Setting
Set realistic goals based on benchmarks:
- Identify your market type and practice category
- Review relevant benchmarks for context
- Set targets at "above average" levels
- Adjust for your specific circumstances
- Track progress over appropriate timeframes
For Vendor Evaluation
Use benchmarks to evaluate agency performance:
- Compare reported metrics to industry standards
- Ask agencies about their benchmark expectations upfront
- Require reporting on standard metrics
- Understand that new accounts need ramp-up time
For Budget Planning
Benchmarks inform budget decisions:
- Cost per lead benchmarks × target lead volume = required budget
- Account for conversion rates at each stage
- Factor in seasonality and market conditions
- Build in testing budget for optimization
Frequently Asked Questions
Why are my costs higher than benchmarks?
Several factors affect costs: market competitiveness, website quality, review profile, ad account history, and targeting. New accounts often exceed benchmarks initially while Google learns and optimizes.
How long should I wait before evaluating against benchmarks?
Give paid channels 3 months minimum. SEO requires 6-12 months. Account for seasonality and market factors.
Do benchmarks account for practice quality?
No. Benchmarks measure marketing performance. Practices with excellent reputations, reviews, and patient experience outperform benchmarks because their marketing converts better.
How often do benchmarks change?
Costs trend upward over time as competition increases. Expect 10-20% annual increases in competitive markets. Performance benchmarks stay more stable.
Should I share benchmarks with my agency?
Yes. Transparency about expectations helps alignment. Good agencies welcome benchmark discussions and set appropriate expectations upfront.
What if I'm below benchmarks across the board?
Systematic underperformance suggests fundamental issues: website problems, poor reputation, wrong agency, or insufficient investment. Audit each area systematically.
Taking Action on Benchmarks
Benchmarks are useful only when applied. Here's how to use this data:
-
Audit current performance: Gather your metrics and compare to relevant benchmarks.
-
Identify gaps: Where are you underperforming? Prioritize the biggest gaps.
-
Set improvement targets: Aim for "above average" benchmarks within 6-12 months.
-
Track consistently: Regular measurement enables trend analysis.
-
Adjust strategies: Let benchmark comparisons inform investment decisions.
At Brandside Digital, we hold ourselves accountable to industry benchmarks and work systematically to outperform them. Our integrated approach across SEO, advertising, and websites delivers measurable results you can track against these standards.
Ready to grow your practice?
Let's discuss how these strategies can work for your practice specifically.
Book a Strategy Call